

What’s new?
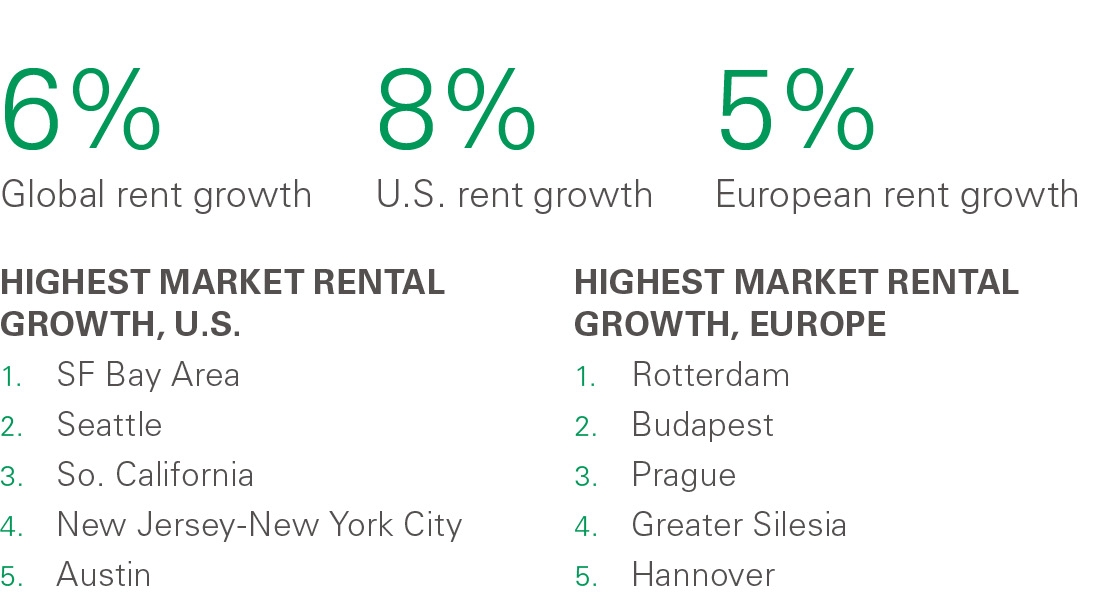
- Logistics real estate rent growth remained considerable in 2018, with rents rising 6% globally.1
- Consistent with the past several years, the U.S. outperformed, with 8% growth.
- However, other regions were just as notable. China was a clear leader with 8% growth. In Europe, rents rose 5%, a near doubling in growth from 2017 and the fastest annual growth in the region based on data reaching back more than 10 years.
Why does it matter?
- Pricing is historically strong, with low vacancies translating to higher rental rates as customers compete for available space.
- High-barrier-to-supply markets with geographic, legislative and other hurdles to new development have the strongest fundamentals.
- Customers who plan well and can act quickly will secure the best space in an increasingly competitive environment.
What’s next?
- Despite recent macro volatility, market vacancy rates are at or near historic lows, leading users to bid rents higher in pursuit of their needs.
- New construction costs are growing at a historically high pace, prompting mid- to high-single-digit annual growth with leading markets well into the double digits.
- Strengthening conditions in Europe are expected to shift growth leadership towards the region.
Global Overview
The Prologis Logistics Rent Index, introduced in 2015, examines trends in net effective market rental growth in key logistics real estate markets in the United States, Europe, Asia and Latin America.2 Our unique methodology focuses on taking rents, net of concessions, for logistics facilities. Prologis Research combines our local insights on market pricing with data from our global portfolio to produce the index.
Key findings:
- Rent growth remains high. Rents grew 6% in 2018, in keeping with similar growth in 2017.
- High growth in the U.S. Expansion continued across the U.S., which posted 8% rent growth. Infill markets continued to outperform areas with fewer barriers to supply.
- Acceleration in Europe. Rental growth escalated to 5%, a break from the recent 2-3% that had characterized the last several years, as growth broadened on the continent, led by a roll down in concessions and increases in headline rates.
- Top growth in China. Multiple factors coalesced to drive rent growth of 8%, showcasing the potential for outsized growth as China’s megalopolises increasingly become infill markets and customers find the need to adopt Class-A space.
- Considerable increases in the cost to build new facilities. This factor is clearly influencing rental rates across the globe.
- Four global themes are aligning:
- Low vacancy. Around the world, vacancy rates are low (many near record levels), particularly for infill submarkets.
- Strong demand. Customer requirements continue to grow amid positive cyclical and structural drivers.
- Greater willingness to pay for quality space. E-commerce, the need to be close to consumers, and rising consumer expectations around speed and product availability are pushing a mandate for quality.
- High development cost increases across all aspects of the project. This includes land, labor, materials and pricing from general contractors and subcontractors.
- Underperformance was broadly attributable to two themes:
- Weak/soft economic trends. Uncertainty stemming from geopolitics, such as NAFTA trade negotiations, subdued activity in those economies.
- Exposure to excess supply. Pockets of excess supply in certain submarkets such as Atlanta, Central Pennsylvania, the Chicago I-80 corridor, Houston, Chongqing in West China and Osaka, Japan have limited rent growth.
What's next for 2019?
Operating conditions are solid, and structural drivers for demand and development economics suggest another year of healthy growth. Of note, Europe appears poised to lead rent growth, as pent-up pricing power is accelerating rent growth on the continent. However, downside global risks include macroeconomic headwinds that could subdue sentiment. Nevertheless, should volatility increase in the general environment, structural drivers will become a more apparent support to growth.
Key themes for 2019 include the following:
- Uncertainty and volatility from the macroeconomic environment. Though far from broad-based, some economic indicators have softened and warrant caution. Uncertainty (e.g., Brexit and U.S.-China frictions) reduces expectations, which could reduce growth.
- Low availability of product. Vacancies in many markets are at or near historic lows and are likely to remain low in the near term. Customer sentiment appears to be forward-looking, focusing on long-term expansion plans.
- Replacement costs are rising. Rents for new buildings are still catching up with the rapid growth in development costs over the past few years, forming an important tailwind for the coming year.
- Location and quality are increasingly important. Building selection is vital to both supply chain efficiency and access to labor, and customers are more mindful of this in light of Last Touch® requirements.
- Barriers to supply. Markets with land scarcity will continue to outperform regional averages. Those markets include New York, Los Angeles, Beijing in North China, Hamburg and Lyon.
What does it mean for customers?
In an era of increased competition, logistics customers with thorough planning processes and a forward-thinking mentality that enables them to act quickly will secure the best real estate at the best prices. Particularly in infill areas, vacancy rates were low and replacement costs rose. At the same time, the importance of proximity to the urban consumer for faster delivery continued to grow. Supply chain evolution and fundamentals suggest that these trends will persist. Logistics planning with an end-to-end view on supply chains must factor in the value of time as a function of distance to consumers. The closer to the end consumer, the better. We expect that rents will continue to rise in 2019—even if at a slower pace.
What does it mean for investors?
Valuations in fast-moving markets can be challenging, and they require a deep knowledge of local markets. Structural drivers should underpin growth. Yet, there will be some instances of outperformance. Location is a more important factor than ever in investment decisions. Markets with high barriers to supply and those serving urban cores will find a steady flow of requirements from both business expansion plans and reassessment of supply chain strategies. Such markets should enjoy long-term forecasts of low vacancies and rent growth.
United States
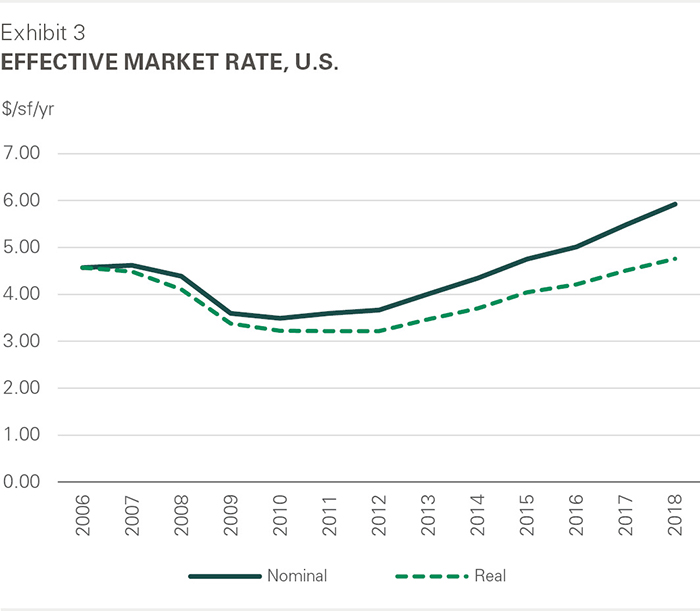
U.S. rent growth outperformed again, with 8.0% in 2018, as both the economics of development and market conditions allowed landlords to command higher rents. Rising labor, materials and land costs pushed replacement costs to new highs. At the same time, stronger economic growth, a structural shift to build out decentralized distribution networks, and a push to stock up inventories ahead of tariffs, lifted demand for space. Even as new deliveries reached their highest level in this cycle, demand was able to exceed new supply, resulting in an historic low vacancy of 4.5%.
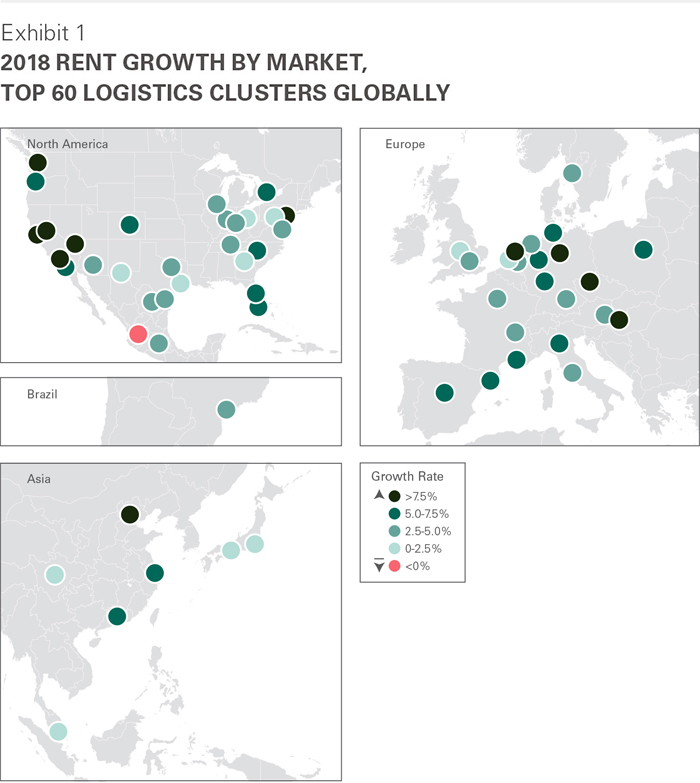
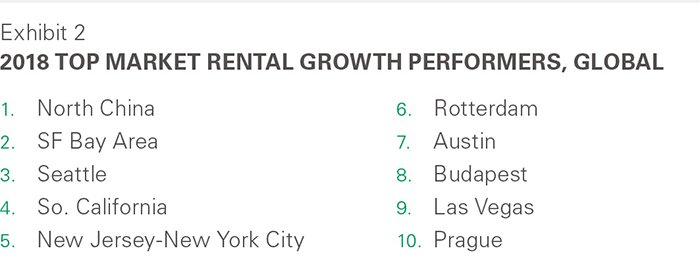
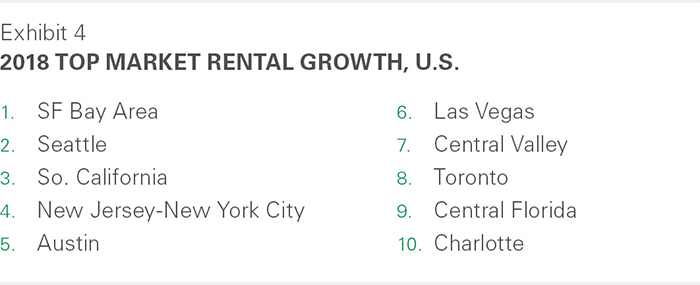
2018 was a year of increasing differentiation in pricing power by location. Coastal markets with high barriers to new supply continued to outperform inland markets, with the double-digit rent growth in Southern California, the San Francisco Bay Area, Seattle and New Jersey/New York City markets. Rising construction costs, low vacancy rates and new peak rents in adjacent markets allowed for surges in rent growth in several secondary markets as well; those markets include Las Vegas, Austin, Portland and Reno.
Within markets, the spread between close-in locations and outlying submarkets widened. This was due largely to weakening market conditions in outlying submarkets as newly delivered bulk product lingered vacant. Submarkets that saw zero or negative effective rent growth include I-80 in Chicago, Henry County in Atlanta, and South Dallas. Within the largest logistics markets, infill rents in 2018 grew up to three times as fast as rents in outlying submarkets.
Europe
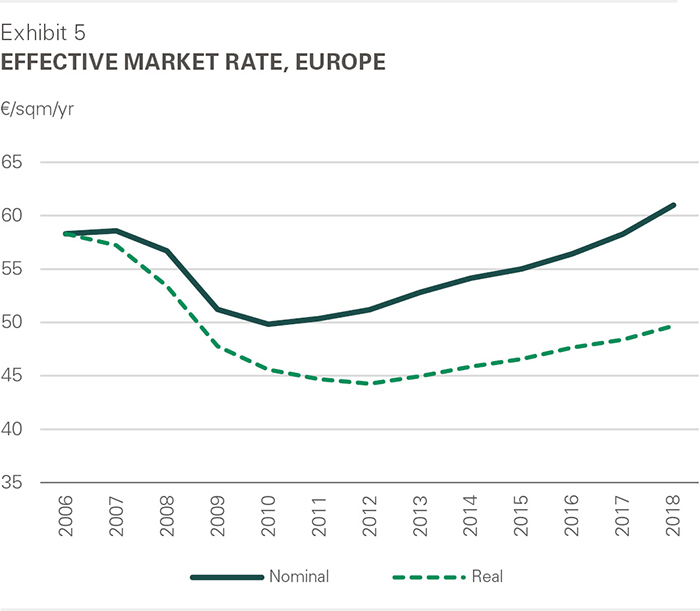
Rent growth accelerated in 2018. Net effective rents rose 5% for Europe as a whole, the highest in data dating back more than 10 years. This growth reflects both increases in headline rents and an unwinding of concessions.
Several drivers coalesced. First is strong market fundamentals, with positive customer sentiment, robust demand, disciplined supply, land scarcity and historic low vacancy of 3.2%. Second, rents are still at a discount compared to prior benchmarks and replacement-cost rents in most markets. Third, replacement costs are rising, driven by increasing construction costs and land prices, which is affecting development underwriting and pushing rent growth in most markets.
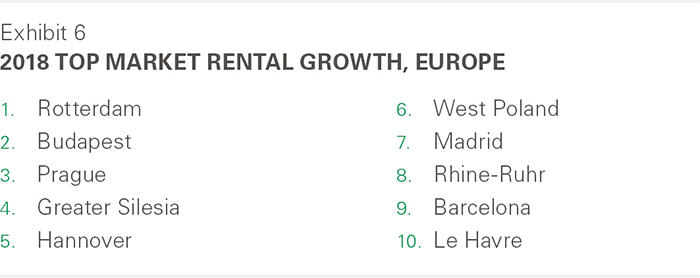
The European continent played an outsized role with 6% growth. Recent years enjoyed only pockets of growth, but the picture changed noticeably in 2018, with increases registered across most markets. Two key themes emerged. First, robust rent growth arose in mature markets such as Munich, Southern Netherlands, Gothenburg and Prague. Rent growth in these markets was driven by strong market fundamentals and land scarcity. Second, markets such as Paris, Warsaw, Silesia and Milan are in the early phase of the rent cycle. Rents in these markets remain closer to their historic lows and supply is less active, creating the potential for rapidly improving market conditions.
Other Regions
In Asia, rental performance has closely mirrored the market fundamental conditions local to each market. Highlights by major regions include:
- In Japan, rental growth has remained slow. Tepid economic conditions and low local inflation trending below 1.0% were clear influences. Supply constrained areas, namely Tokyo Bay, experienced moderate rental gain over the past year. The peripheral areas of Tokyo and Osaka, where barriers to supply are lower, experienced inflationary growth. Looking forward, rental growth should strengthen. Although the extended period of cap rate compression is tapering, construction costs continue to rise while construction companies continue to approach bids selectively. The upcoming 2020 Olympics in Tokyo and the Osaka World Expo 2025 are further reinforcing growth in construction pricing.
- In China, a confluence of factors led to sharply increased rents. Most notably in North China, warehouse closures, resulting from a local government crackdown on substandard facilities, sent rents in Beijing up by about 30%, while the outflux of users escalated rents in Tianjin. Supply constraints also contributed to the strong rent growth in other tier 1 cities. 3PLs, express delivery and cold-chain logistics businesses were particularly active, bidding to secure space for expansion plans nationwide. Although supply continues to build on a national level, tier 1 cities and their surrounding satellite cities have been limiting logistics development due to land scarcity and relatively low local tax revenues that logistics users generate. With customers forced to seek space farther from city centers, the value of urban locations continues to rise, providing a healthy outlook for rents near consumption centers.
In Latin America, diverging business sentiment in the regional geopolitical outlook impacted market rental growth.
- In Mexico, geopolitical events had a mixed impact on operating environments in 2018. Overall market rental growth increased by 3% in 2018 in the six main logistics markets. Along the border, uncertainty surrounding U.S.-Mexico trade relations curtailed the development cycle, which resulted in a positive supply/demand imbalance in 2017 and the first half of 2018 and translated to solid market rental growth. As NAFTA uncertainty ebbed, uncertainty surrounding U.S.-China trade relations boosted demand from Asian manufacturing customers to expand operations in Mexico, adding another tailwind for production-oriented markets, such as Tijuana (+5.1% USD) and Monterrey (+3.7% USD). However, policy uncertainty surrounding the new administration impacted business confidence and in turn passed through to the peso, which slowed rental growth in Guadalajara. Softness in the operating environment, coupled with willingness of local developers to accept peso leases and quote in peso terms without regard for FX movement, translated to negative demand for USD lease terms and rental rates. Peso-denominated rental growth was flat in Guadalajara in 2018.
- In Brazil, the nascent economic recovery was boosted by improving business confidence in the new administration’s market-friendly reforms agenda. Market rental growth increased modestly in São Paulo and was up 3% in 2018.
2019 Outlook
- Rents are expected to rise throughout 2019, despite some rising uncertainty. Strong fundamentals in nearly all markets warrant continued competition for the buildings that customers need to expand their businesses.
- Replacement costs are rising. Development cost growth over the past few years has broken records. Rents for new buildings are still catching up, forming an important tailwind for the coming year.
- Location and quality are increasingly important. Logistics facility selection is vital to both supply chain efficiency and access to labor, and customers are keeping this in mind as they work to meet Last Touch® requirements.
- Barriers to supply. Markets with land scarcity will continue to outperform regional averages. Such markets include New York, Los Angeles, Beijing in North China, Hamburg and Lyon.
Insight: Concession Levels Across the Globe
Throughout this report, we refer to rental rates on a net effective basis. Net effective rents are principally net of free rent. By doing so, we focus on the true economic terms of the offer. The global average free rent equates to roughly 5% of rent, or less than one month per year of term. In our 2016 paper, we highlighted that a handful of markets use concessions aggressively, in some cases creating inducements that can amount to more than 25% of total rent. This can skew the market’s perception of rents. We also noted that leases in Poland offer the most concessions among markets around the world. However, as of this writing, concessions in Poland have begun to decline and in fact are now more than 20% lower than in 2016.
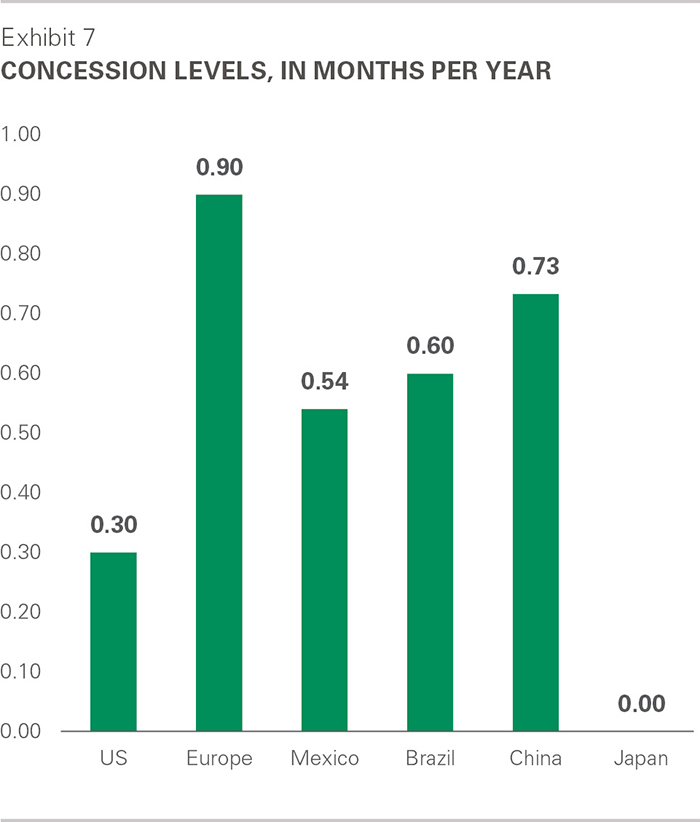
Concession levels have been dwindling across the globe, but we do see differences. In Europe, concession levels are varied as transparency and the rates of recovery differ by market. Overall, concessions have clearly declined from 2010 peak levels of 2.1 months per year to just 0.9 in 2018. Levels lag the U.S., which has led rental growth over the past few years. Japan, a market known for its stability, has zero months of concessions. Emerging markets are broadly similar, with Mexico leading.
TOEKOMSTGERICHTE VERKLARINGEN
Dit materiaal mag niet worden opgevat als een aanbod tot verkoop of een uitnodiging tot het doen van een aanbod tot aankoop van enig effect. Wij verzoeken niet om enige actie op basis van dit materiaal. Het is ter algemene informatie van klanten van Prologis.
Dit rapport is gedeeltelijk gebaseerd op openbare informatie die wij betrouwbaar achten, maar wij verklaren niet dat deze nauwkeurig of volledig is, en er mag niet op vertrouwd worden. Er wordt geen verklaring gegeven met betrekking tot de nauwkeurigheid of volledigheid van de informatie in dit rapport. Geuite meningen zijn alleen onze huidige meningen op de datum die in dit rapport staat. Prologis wijst alle aansprakelijkheid met betrekking tot dit rapport af, met inbegrip van, maar niet beperkt tot, alle expliciete of impliciete verklaringen of garanties voor verklaringen of fouten in, of weglatingen uit, dit rapport.
Schattingen, projecties of voorspellingen in dit rapport zijn bedoeld als toekomstgerichte verklaringen. Hoewel wij menen dat de verwachtingen in dergelijke toekomstgerichte verklaringen redelijk zijn, kunnen wij niet garanderen dat toekomstgerichte verklaringen juist zullen blijken te zijn. Dergelijke verwachtingen zijn onderworpen aan bekende en onbekende risico's, onzekerheden en andere factoren die ertoe kunnen leiden dat de werkelijke resultaten wezenlijk verschillen van de voorspelde resultaten. Deze toekomstgerichte verklaringen gelden alleen op de datum van dit verslag. Wij wijzen uitdrukkelijk elke verplichting of verbintenis af om toekomstgerichte verklaringen in dit verslag bij te werken of te herzien om veranderingen in onze verwachtingen of veranderingen in de omstandigheden waarop een dergelijke verklaring is gebaseerd, weer te geven.
Niets uit dit materiaal mag (i) worden gekopieerd, gefotokopieerd of verveelvoudigd in welke vorm dan ook of (ii) worden verspreid zonder voorafgaande schriftelijke toestemming van Prologis.
OVER PROLOGIS RESEARCH
De afdeling Research van Prologis bestudeert fundamentele en investeringstrends en de behoeften van de klanten van Prologis om te helpen bij het identificeren van kansen en het vermijden van risico's op vier continenten. Het team draagt bij aan investeringsbeslissingen en strategische langetermijninitiatieven, naast het publiceren van white papers en andere onderzoeksrapporten. Prologis publiceert onderzoek naar de marktdynamiek die de activiteiten van Prologis' klanten beïnvloedt, met inbegrip van wereldwijde supply chain kwesties en ontwikkelingen in de logistieke en vastgoedsector. Het toegewijde onderzoeksteam van Prologis werkt samen met alle afdelingen van het bedrijf om Prologis te helpen bij het sturen van strategieën voor markttoegang, uitbreiding, overname en ontwikkeling.
OVER PROLOGIS
Prologis, Inc, is de wereldwijde leider in logistiek vastgoed met een focus op markten met hoge barrières en hoge groei. Per 31 december 2019 was het bedrijf eigenaar van of had het investeringen in, op basis van volledige eigendom of via co-investeringsvennootschappen, vastgoed en ontwikkelingsprojecten die naar verwachting in totaal ongeveer 964 miljoen vierkante voet (89 miljoen vierkante meter) in 19 landen zullen bedragen.
Prologis verhuurt moderne logistieke faciliteiten aan een gevarieerde basis van ongeveer 5.500 klanten in twee belangrijke categorieën: business-to-business en retail/online fulfillment.
voetnoten
1. Prologis Research ontwikkelde en onderhoudt een database van netto effectieve huurtarieven in 60 van 's werelds toonaangevende logistieke markten. De wereldwijde en regionale indexen zijn gebaseerd op de vierkante meters modern logistiek vastgoed en de geldende huurprijzen. De cijfers voor Prologis zouden anders zijn gezien haar grotere blootstelling aan markten met een hogere huurgroei.
2. Prologis Research introduceerde de eigen Prologis Rent Index in 2015. Dit rapport van 2018 is
onze derde update. Voor toegang tot het vorige Index rapport, klik hier.